 This post brings more meat to the bones. However, the first step is still saving, optimizing spending and not getting into debt. Have you already mastered this? If so, what do you do with the hard earned and saved money?
You know, our money on a savings account loses its value in the long run (thanks to inflation and above all bank charges). So, we want to let our money work for us so that it increases in value and brings us closer to the luxury of time.
This post shows you how you can let your money work for you.
Oscar and I are working on the luxury of time, we’re gonna be rich in time. With 5 times a week 8 to 10 hours of work a day, however, it becomes difficult. Hmm, let’s do it like the rich… but without being rich – we let our money, our savings work for us. But how the hell do we do that?
We could entrust our money to a fund manager. We pay him to manage our money and above all to increase it. Because the money has to be managed by an expert, otherwise the risks are too high. Gooselike!
The financial advisor – if he were successful, would he still be working?
The dear financial industry does quite a lot to make us believe the above (experts that is what the people are in need of). The financial industry wants us to believe that the topic of finance is hyper-complicated, that the world’s stock exchanges are only for professionals, that only the banks and their experts know how the financial monopoly would work.
But if that were so, why
- is the financial advisor personally never invested in the great products that he himself proposes?
- do only 15% to 20% of all funds beat the self-imposed benchmark?
- do the financial experts employed and work for a salary?
To question 1: Very likely because the financial expert knows the answer to the second question and because he has to propose products or because these products yield the best commission for him.
To question 3: Because expert knowledge does not make experts for a long time.
The second question/point is interesting for us. We won’t give any references here, but if you search the internet you’ll find several sources that claim that only 15% to 20% of all funds beat their own benchmark. This matter we can imagine very well, because if the banks work nevertheless so well with the customer money, why must they introduce then nearly worldwide fees for a dog-ordinary savings account and set the interest on 0%?
An example: A financial guru “Mister Market” invests in shares on the American stock market. Next, “Mister Market” takes the S&P 500 as his benchmark – because the S&P 500 is an index that represents a market capitalization-weighted index of the 500 largest listed US companies by market value. If “Mister Market” stays above the S&P 500 for several years with his profits of the fund, he belongs to the elite – the 15% to 20% that beat their benchmark.
According to various sources on the internet, the S&P 500’s annual return over 15 years is between 7% and 9%. This means that if “Mister Market” achieves an average annual return of 9.1%, he ranks among the top 20%.
We conclude that if we trust a financial guru, we only have a 20% chance of earning more than 7% to 9% return per year. However, we still have to pay the financial guru, which further reduces our return.
Buy & Hold
So if we have an 80% chance of earning less than the 7% to 9% return per year, then we can invest directly in the S&P 500 and therefore, assuming the future is similar to the past, we will achieve at least an annual average yield of 7% to 9%.
This approach is called “Buy & Hold”. “Buy & Hold” is a passive investment strategy in which an investor buys shares or ETFs and holds them over a long period of time regardless of market fluctuations.
For the so-called long period, we define at least 10 years and more… Mega-short explanation: 10 years, so that drawdowns of the S&P 500 can be balanced out again over time. Perhaps we will explain why this makes sense in another post. And when we remember it, we even link it here. Wuu-uh!
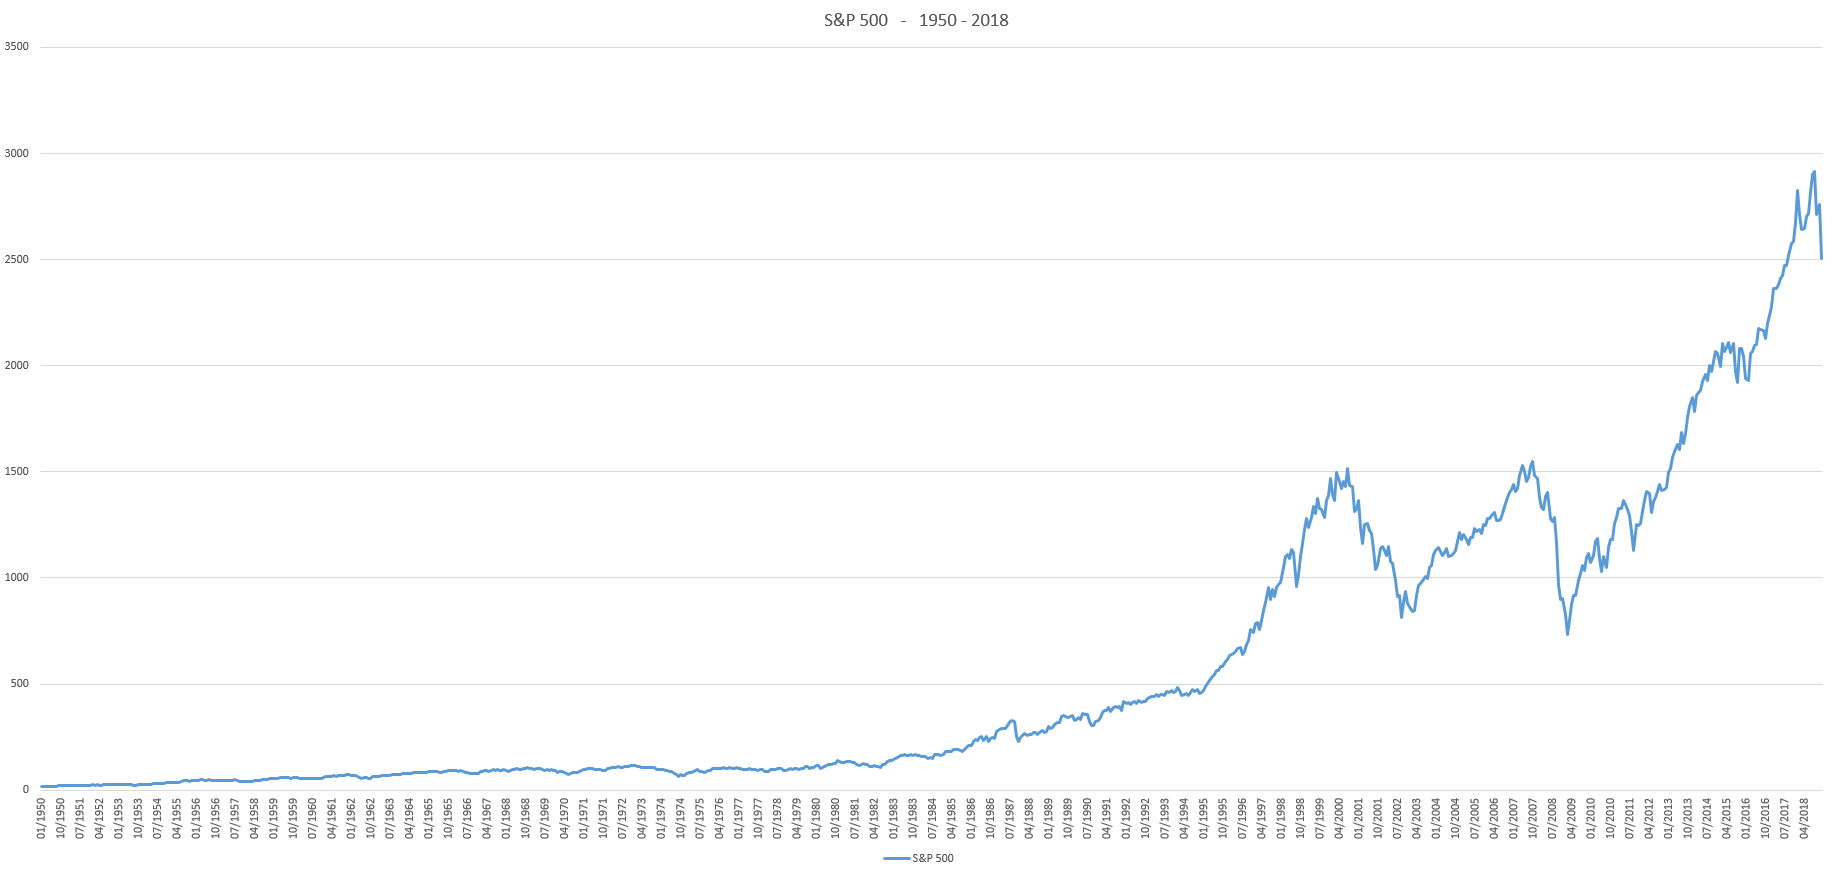
Above, we see the S&P 500 chart from 1950 to December 2018. In January 1950 the S&P 500 was at 17.05 points. End of December 2018 at 2506.85 points. Calculated over this time span, this results in an annual interest rate of 7.62% (dividends are not taken into account, otherwise the annual interest rate would be somewhat higher). And this despite the large fluctuations between 2000 and 2008 and this also without lifting a finger – invest and leave it – “Buy & Hold”.
A little mental game (rounded): We save 500 every month and invest it at 7.62% per year for 10 years. After 10 years we have saved 60,000 and earned interest of 30,000 – 50% on the total savings. That’s a total of 90,000. How cool is that?
Don’t lose money with the recession
Of course, it would have been cool if we had been able to avoid the sharp price declines in 2001 to 2003 and 2008/2009 with little effort. This means that we would have to recognize a good entry and exit into the market at the right time. We do not want to include short-term fluctuations (so-called volatility – such as at the end of 2018), because these are:
- Very difficult to “time”
- Labour-intensive, so it will be nothing with “rich in time”.
The internet knows a lot and never forgets – Oscar and I went on a search and found what we were looking for. We found 2 very interesting blog posts:
- Growth and Trend: A Simple, Powerful Technique for Timing the Stock Market
- In Search of the Perfect Recession Indicator
Thanks to the author of the blog “Philosophical Economics“.
The Recession Indicator could help us to identify large and longer-term declines. The “Recession Indicator” is the unemployment rate, because in a recession the unemployment rate usually rises.
| Recession Start | Recession End | Duration (month) |
|---|---|---|
| 11/1948 | 10/1949 | 11 |
| 07/1953 | 05/1954 | 10 |
| 08/1957 | 04/1958 | 8 |
| 04/1960 | 02/1961 | 10 |
| 12/1969 | 11/1970 | 11 |
| 11/1973 | 03/1975 | 16 |
| 01/1980 | 07/1980 | 6 |
| 07/1981 | 12/1982 | 17 |
| 07/1990 | 03/1991 | 8 |
| 03/2001 | 11/2001 | 8 |
| 12/2007 | 06/2009 | 18 |
Above is a small overview of the recessions in America from 1948 until today. It is interesting to note that the recent recession has also affected Europe – thanks to globalization. So the whole thing could apply to the US and Europe – recession in America = recession in Europe, or at least similar stock market behavior in the US and Europe.
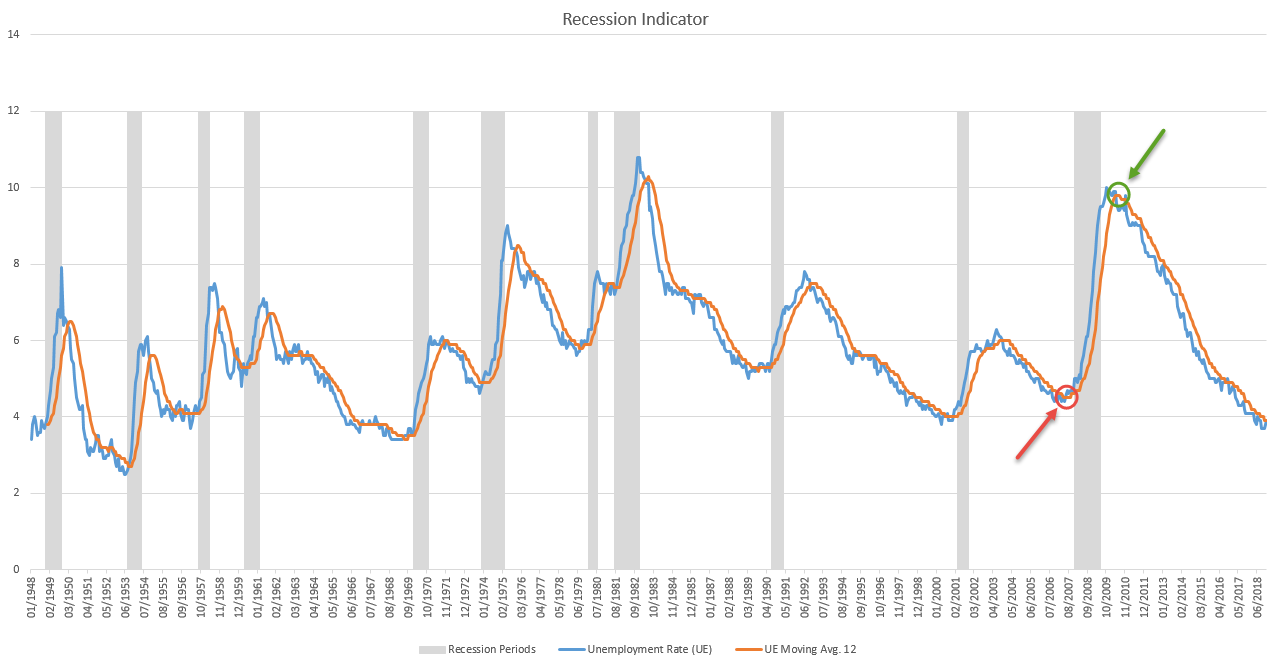
The unemployment rate in the USA and the recessions in the USA, superimposed, give the following chart:
We recognize that in a recession the unemployment rate rises more and more. However, we do not want to recognize the rise when it is over. But how can we record or determine the rise in the unemployment rate? With the so-called “moving average”. We take the moving average over 12 months of the unemployment rate and place it on the chart.
When the moving average cuts the unemployment rate curve from top to bottom (red arrow), the recession begins, so to speak. In the reverse case, when the moving average cuts the unemployment rate curve from bottom to top (green arrow), the recession is over.
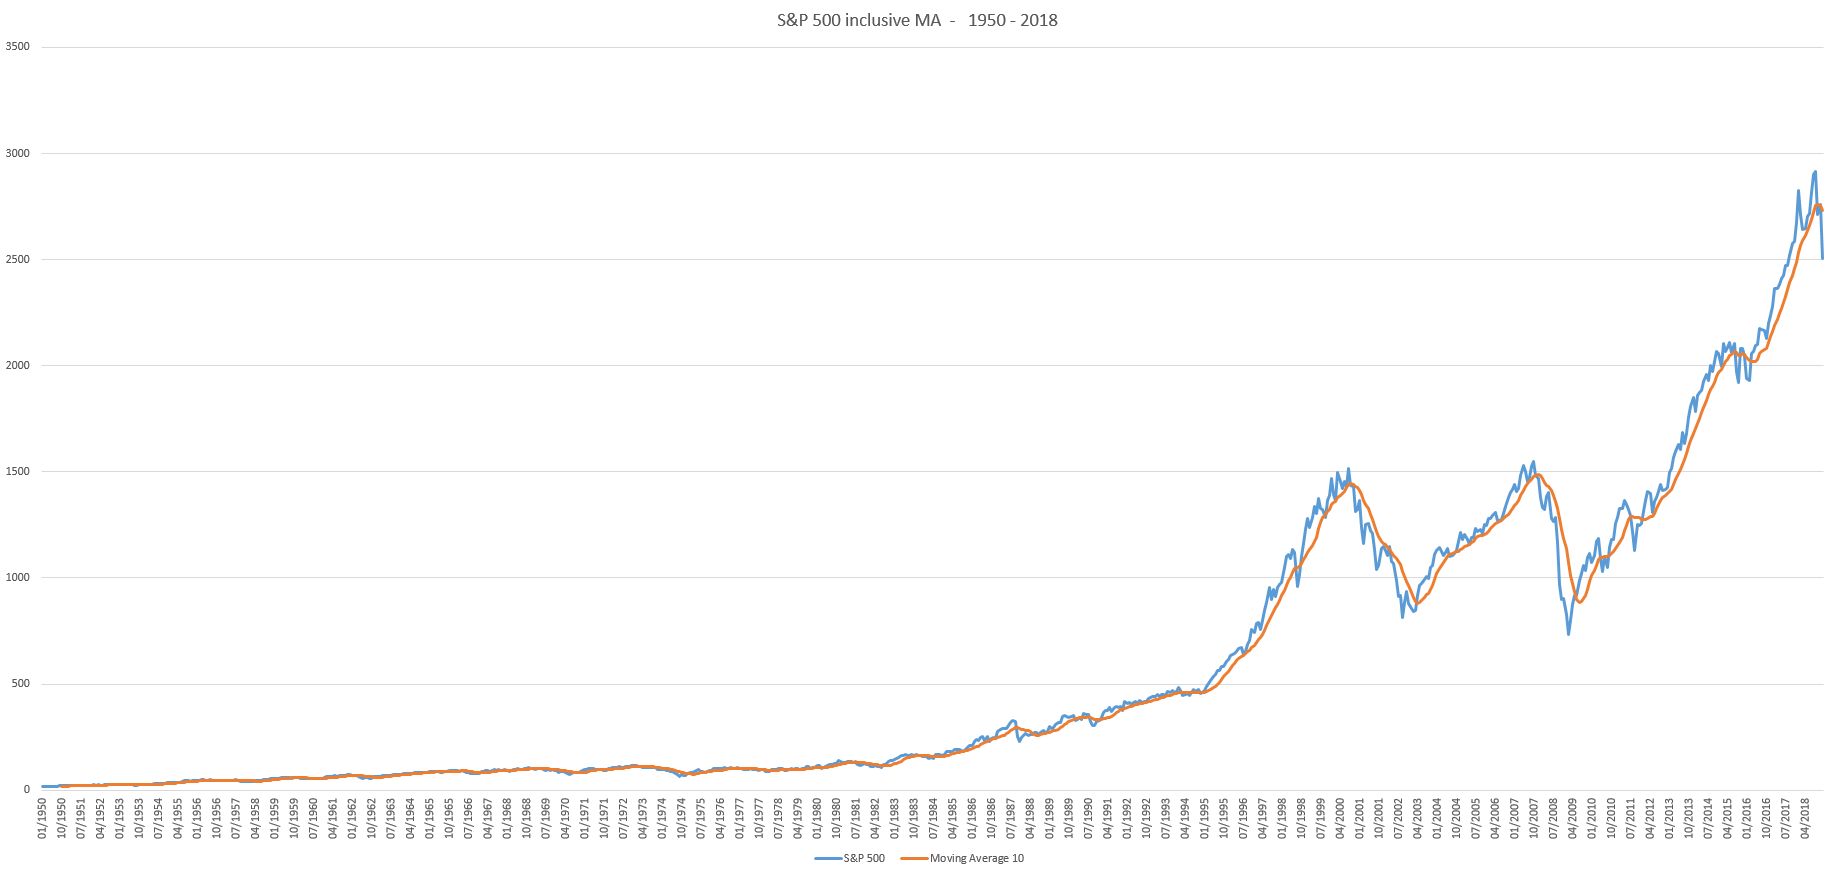
Now we combine these insights with an ordinary “moving average” trend trading strategy. Such a strategy takes the moving average of a price to determine the trend. Entry when the price cuts the moving average from bottom to top and exit when the price cuts the moving average from top to bottom.
Our savings also need clear rules (RTT)
The trading rules, which the author of the blog “Philosophical Economics” derives from it, are as follows:
Rule 1: If the unemployment rate trend is declining, i.e. does not indicate an imminent recession, then we are 100% invested.
- Rule 2: If the upward trend in the unemployment rate points to an imminent recession, then we look at the price trend of the stock or the ETF. If the price trend points upwards, then we are 100% invested. If the price trend of the shares or the ETF points downwards, then we are invested at 0%.
In summary: The leading indicator is the recession indicator. We are 100% invested as long as no recession is indicated. If a recession is indicated, we look at the moving average of our investment – as long as it shows an upward trend, we stay invested. Conversely, to put it simply, if the investment trend is down and the recession indicator strikes, then we get out.
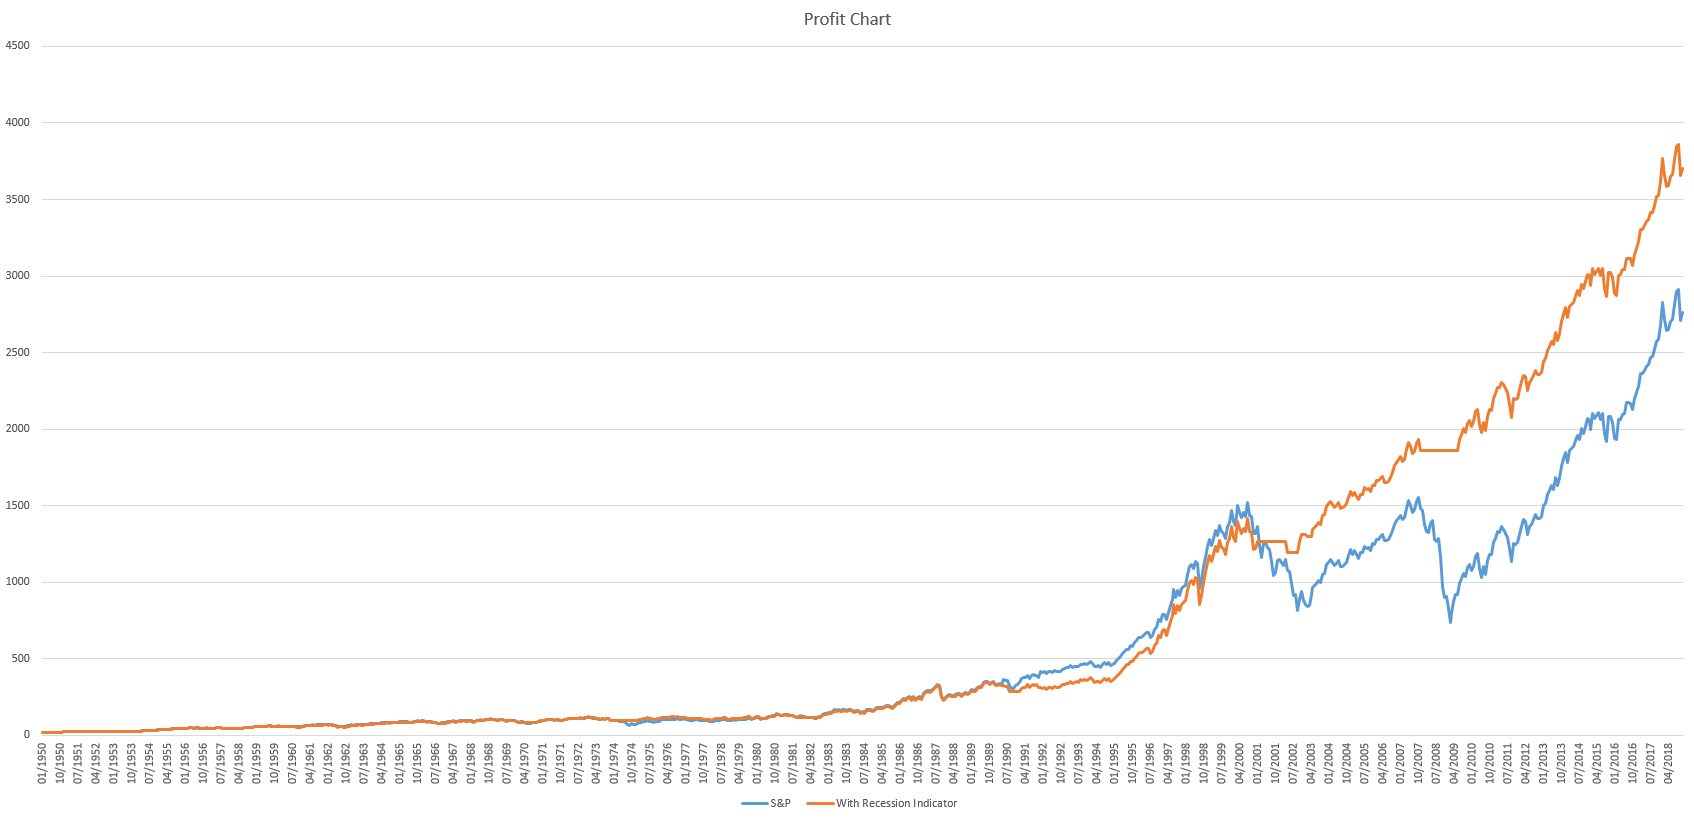
So if we include the Recession Indicator instead of Buy&Hold, we get the Recession Trend Trading Strategy (RTT). There are some phases where we are not invested. These phases should be the ones where we see major price declines, giving us an advantage by getting out first and getting back in close to the bottom.
A “backtest” by RTT shows that after about 68 years, i.e. from the start of January 1950 to the end of December 2018, we achieved a whopping 3433.23 points starting from 17.05 points – this results in an average annual interest rate of 8.11%. The total profit compared to “Buy&Hold” was increased by approx. 38%.
But Oscar has an objection: “Just because there’s a recession doesn’t mean that our money shouldn’t work…”. Well roared, Mr. Bear!
Earning more money with the recession
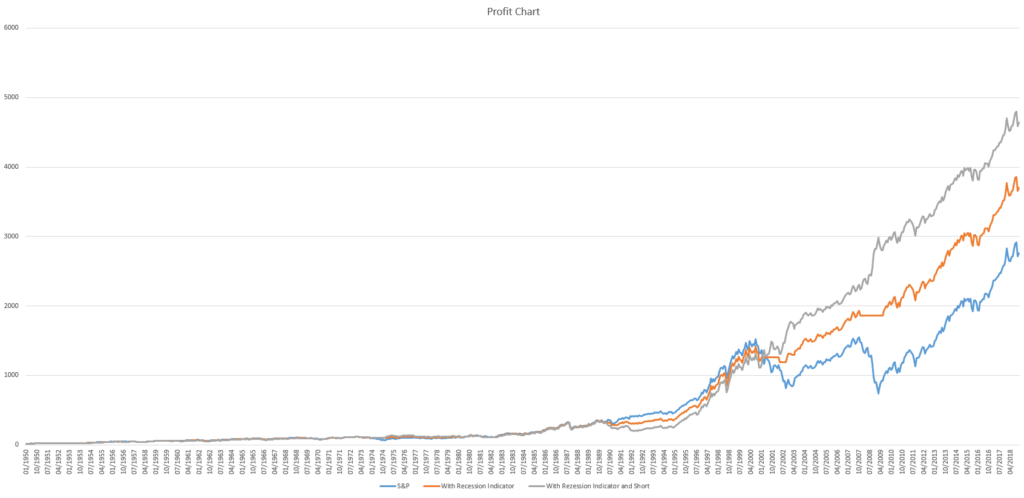
Well, we are trying to expand the above strategy by shortening the market when the Recession Indicator strikes a downtrend. This is particularly interesting in view of the two major market declines from 2001 to 2003 and 2008/2009. This means that we are always invested in the market and try to keep up with the market. In short: “Recession Trend Trading with Short” strategy (RTTS strategy).
This results in the following profit curve:
Expressed in numbers, this means for RTTS:
- Period 68 years
- Start January 1950 with 17.05
- End December 2018 with 4376.66
- Annual average interest rate of 8.50%
If we take a closer look at this story (before 2000), “to short” did not (yet) work so well – prices were too low and the declines were too short or partly interrupted by the recession indicator. Therefore, it was not until 2001 that the short strategy was more profitable than the other two strategies.
Comparison
The timeframe for backtesting is exactly 68 years, from January 1950 to December 2018. The analysis and adjustments were carried out once a month. Transaction costs were not considered and any dividends that would be reinvested are not included. The transaction costs would have a negative impact on the final result, while the dividends would have a positive impact – since the transaction costs are minimal with these strategies, the final result would be more positive overall.
| Buy&Hold | RTT | RTTS | |
|---|---|---|---|
| Absolute development | 2489.80 | 3433.23 | 4376.66 |
| Percentage | 100% | 138% | 176% |
| Annual average interest rate | 7.62% | 8.11% | 8.50% |
| Number of transactions | 1 | 24 | 48 |
| Winning transactions | 1 | 14 | 23 |
| Losing transactions | 0 | 10 | 25 |
| Absolutely Max. Loss in percent at the current course price | 0% | 6% | 8% |
| Relative Max. Loss in percent at the current course price | 0% | 11% | 10% |
As we can see, even with the most complex investment strategy RTTS the effort is kept within limits – update the figures once a month (1 minute) and make less than 1 transaction per year – if only one initial investment is made. However, we would set up a savings plan where we would invest a fixed monthly amount, exactly according to the rules.
Meat on the bone
Next, we describe the investment strategies (yes, all) with clear rules and instructions, with product information so that they can be implemented immediately. In addition, we create an Excel help tool that is manually updated once a month at the beginning of the month that immediately shows whether a transaction is necessary or not (not necessary for Buy&Hold, of course).
We will also implement the RTTS strategy in a live account from January 2019.
We will continue the analysis a little further and try to extend the history to Europe and perhaps even generalize it worldwide.
So, stay tuned!
The tools used to process this case are listed below in the tool list. By the way, these links are also available in the “Tools” section.
Tools list:
- EOD S&P 500
- Zinsen berechnen (only in German)
- Economic principles by Ray Dalio
- Fred – economic research
And by the way, because the financial industry and the governments of this world want it that way and they probably think that all readers are stupid, here is a little supplement: Investing and trading holds risks in the sense that you could lose all your money. So this blog post is for information and entertainment only and no guarantee of any success or profit. The past may look beautiful, but it doesn’t tell you anything about the future and certainly doesn’t guarantee profits. So if you gamble (invest or trade), you do so at your own risk and it’s entirely your own responsibility – just like your whole life and every single one of your actions if anyone finally gets it!
And by the way twice:
Recession Ahoy!
The price of the S&P 500 has mercilessly pierced the moving average in the last month of 2018. And the unemployment rate curve of 3.9 in December 2018 is right on the moving average of the unemployment rate. What does that tell us?



Leave A Comment